
Why should I use Pivot Tables?
- Joanne @ Paramount

- Jul 19, 2022
- 2 min read
The time has come for us to share our love of pivot tables and why you should feel the same! We often say that pivot tables are one of our favourite things; they are one of Excel's most powerful tools as they can pull out the key data you want to know from a large and complicated data set.
Here’s why you should be using pivot tables in your everyday work:
Pivot tables summarise vast amounts of data by customer, product, date, salesperson etc. very easily.
They can help you to answer important questions about your stakeholders, customers and employees. For example, your best-selling product, the customers buying from you the most, your best customers, whether you sold more this year compared to last and your top sales staff! They can then present all this information in a pie chart!
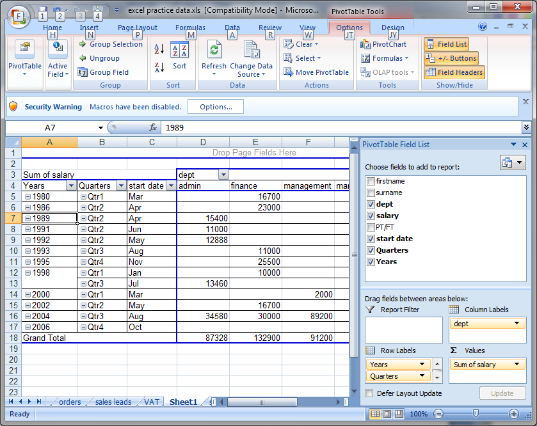
They don’t require any fuss - you can literally drag and drop the things you want to report on into the pivot table.
You don’t need to use formulae, so it’s great if that’s not your forte! However, interestingly, you can add formulae to project if you want - for example, what a 5% increase on sales next year will equate to.
We’ve previously heard our clients say:
“I was frightened of pivots… they look scary”
“I don’t know whether to put data into columns or rows - how on earth can you tell?”
“My manager has to do it for me”
Here at Paramount Training, we can support you and your team by customising a course that’s bespoke to you. We can either add pivot table training to a course where we cover other useful Excel topics of your choice, or we can start a session focusing on how to create a pivot table, before adopting a workshop-style approach for the rest of the session to encourage you to get hands on with your own data and see what happens when you pivot table it! This allows you to get stuck in applying your new knowledge of pivot tables under our watchful eye in case you get stuck.
If you’re spending endless hours trying to calculate, summarise, and analyse data, pivot tables are the answer! Now, our clients say:
“I used to spend hours summarising my data for my manager, using filtering and sorting etc. Now, I can create a pivot table in a couple of minutes to achieve the same thing”.


Comments